When you write bugs – oops, I meant software – you can always rely on your faithful debugger to trap those miserable bugs from Planet P. As Lt. Jean Rasczak would say: “All right. SPREAD OUT! Fire Teams, you see a bug hole, NUKE IT!”. That’s what we do, yeah! And yes, you may have to bring a knife in a nuke fight, and that’s called
printf. So now that we are covered in the SW side, what about the HW? I don’t know for you, but I am a visual guy, and I need to see – not always literally, but having a mental visualization of the problem/algorithm is key for me. One major aspect of DIY projects is communications. Indeed, the modern electronics industry often gives us pretty complete building blocks ready to use. In many cases, you will need to communicate with them so you can orchestrate the use of their features as your application needs. A decade ago, the preferred communications were the infamous RS232. Nowadays, I2C or SPI are the stars. I recall the build I did when we launched a data acquisition system into the stratosphere (
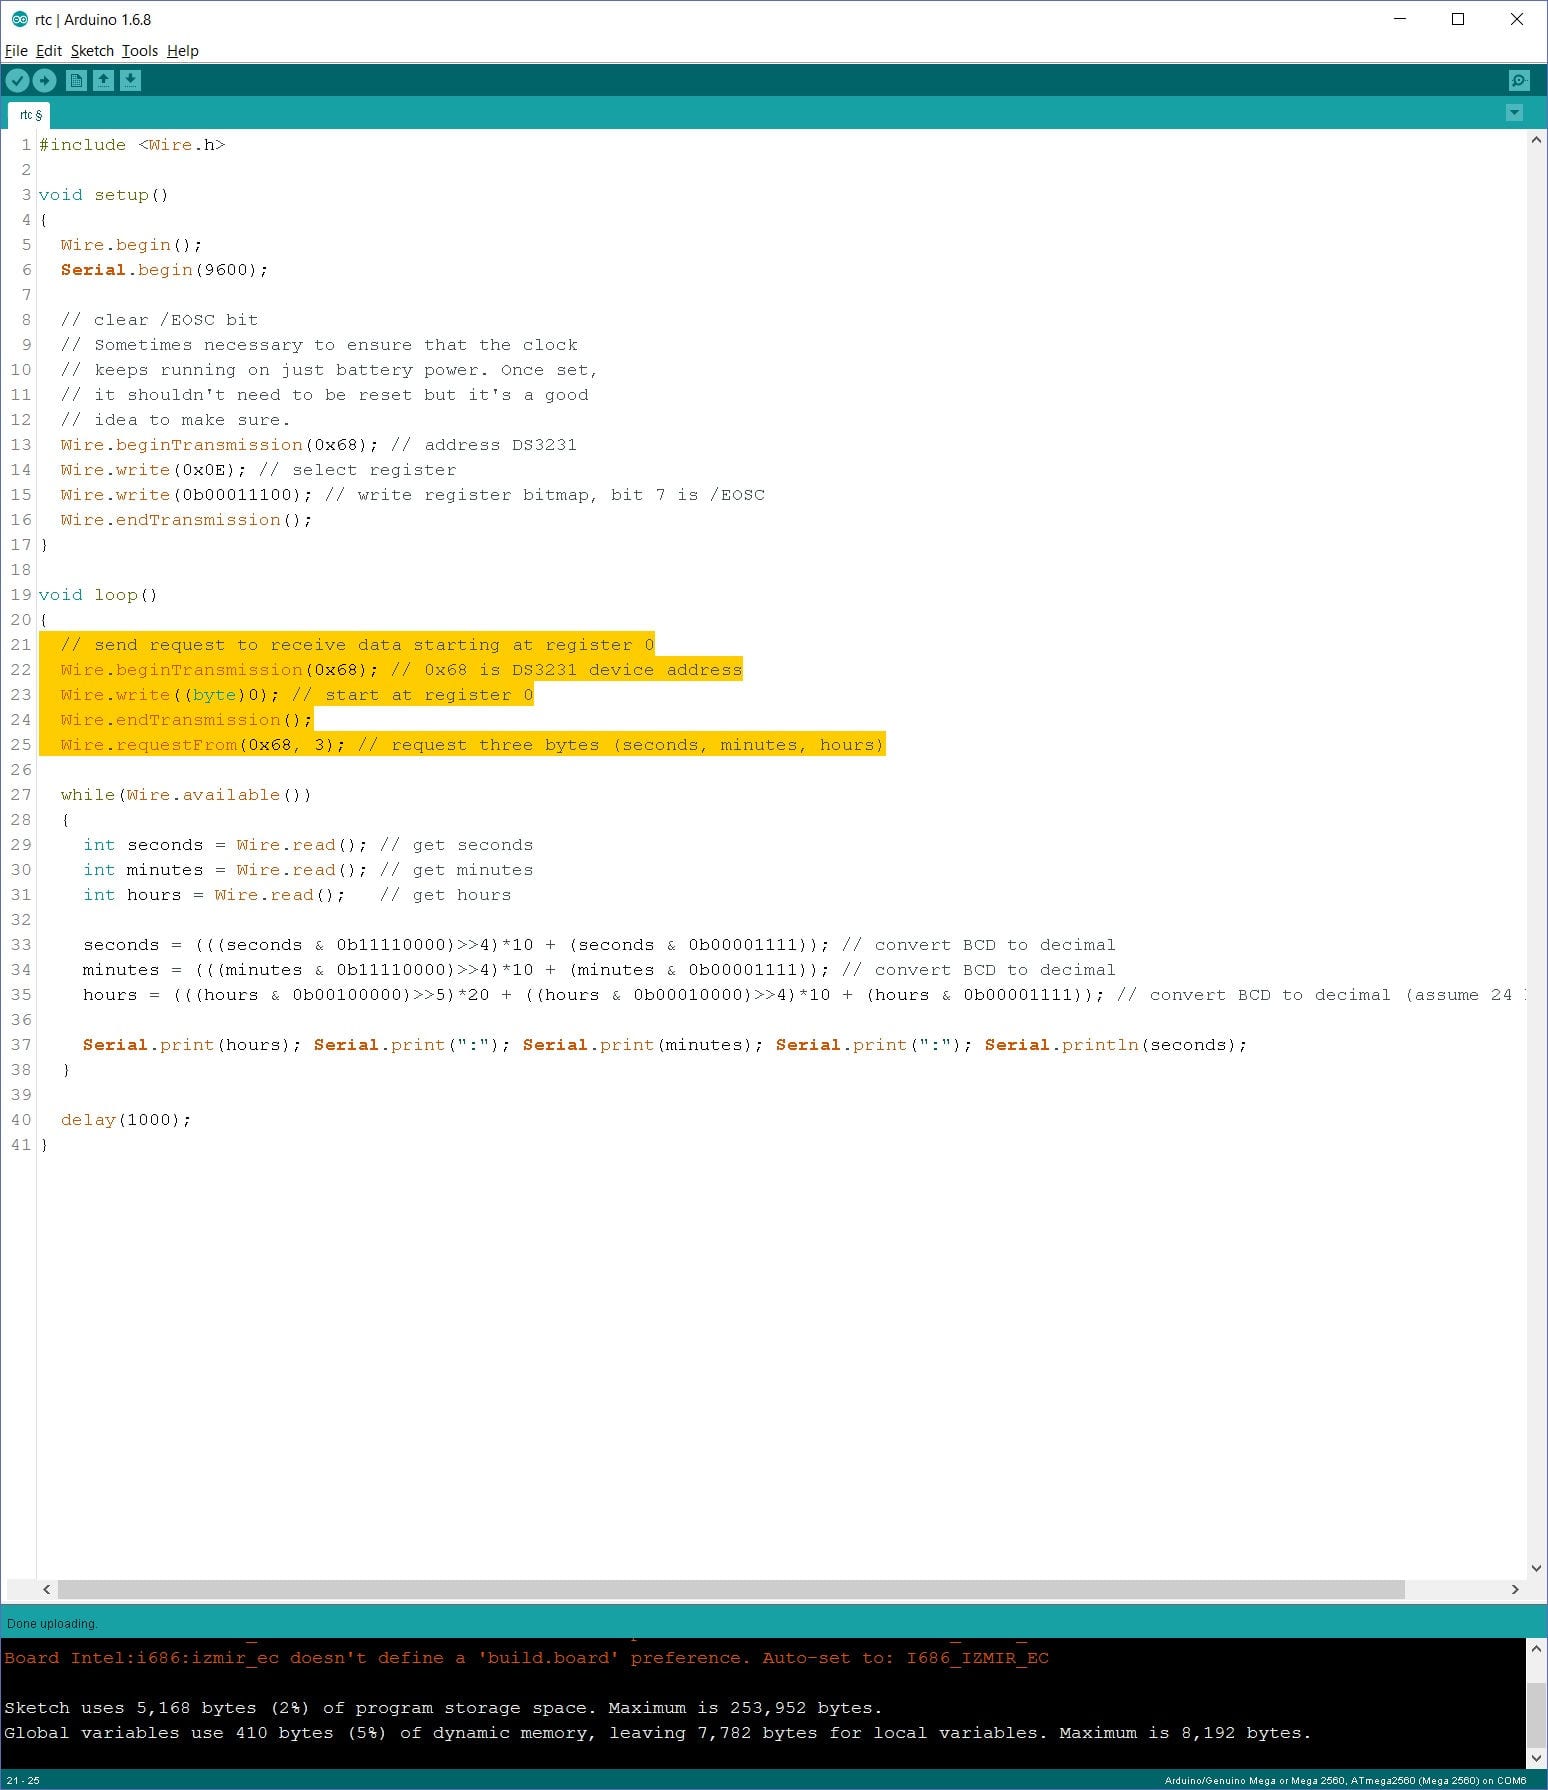
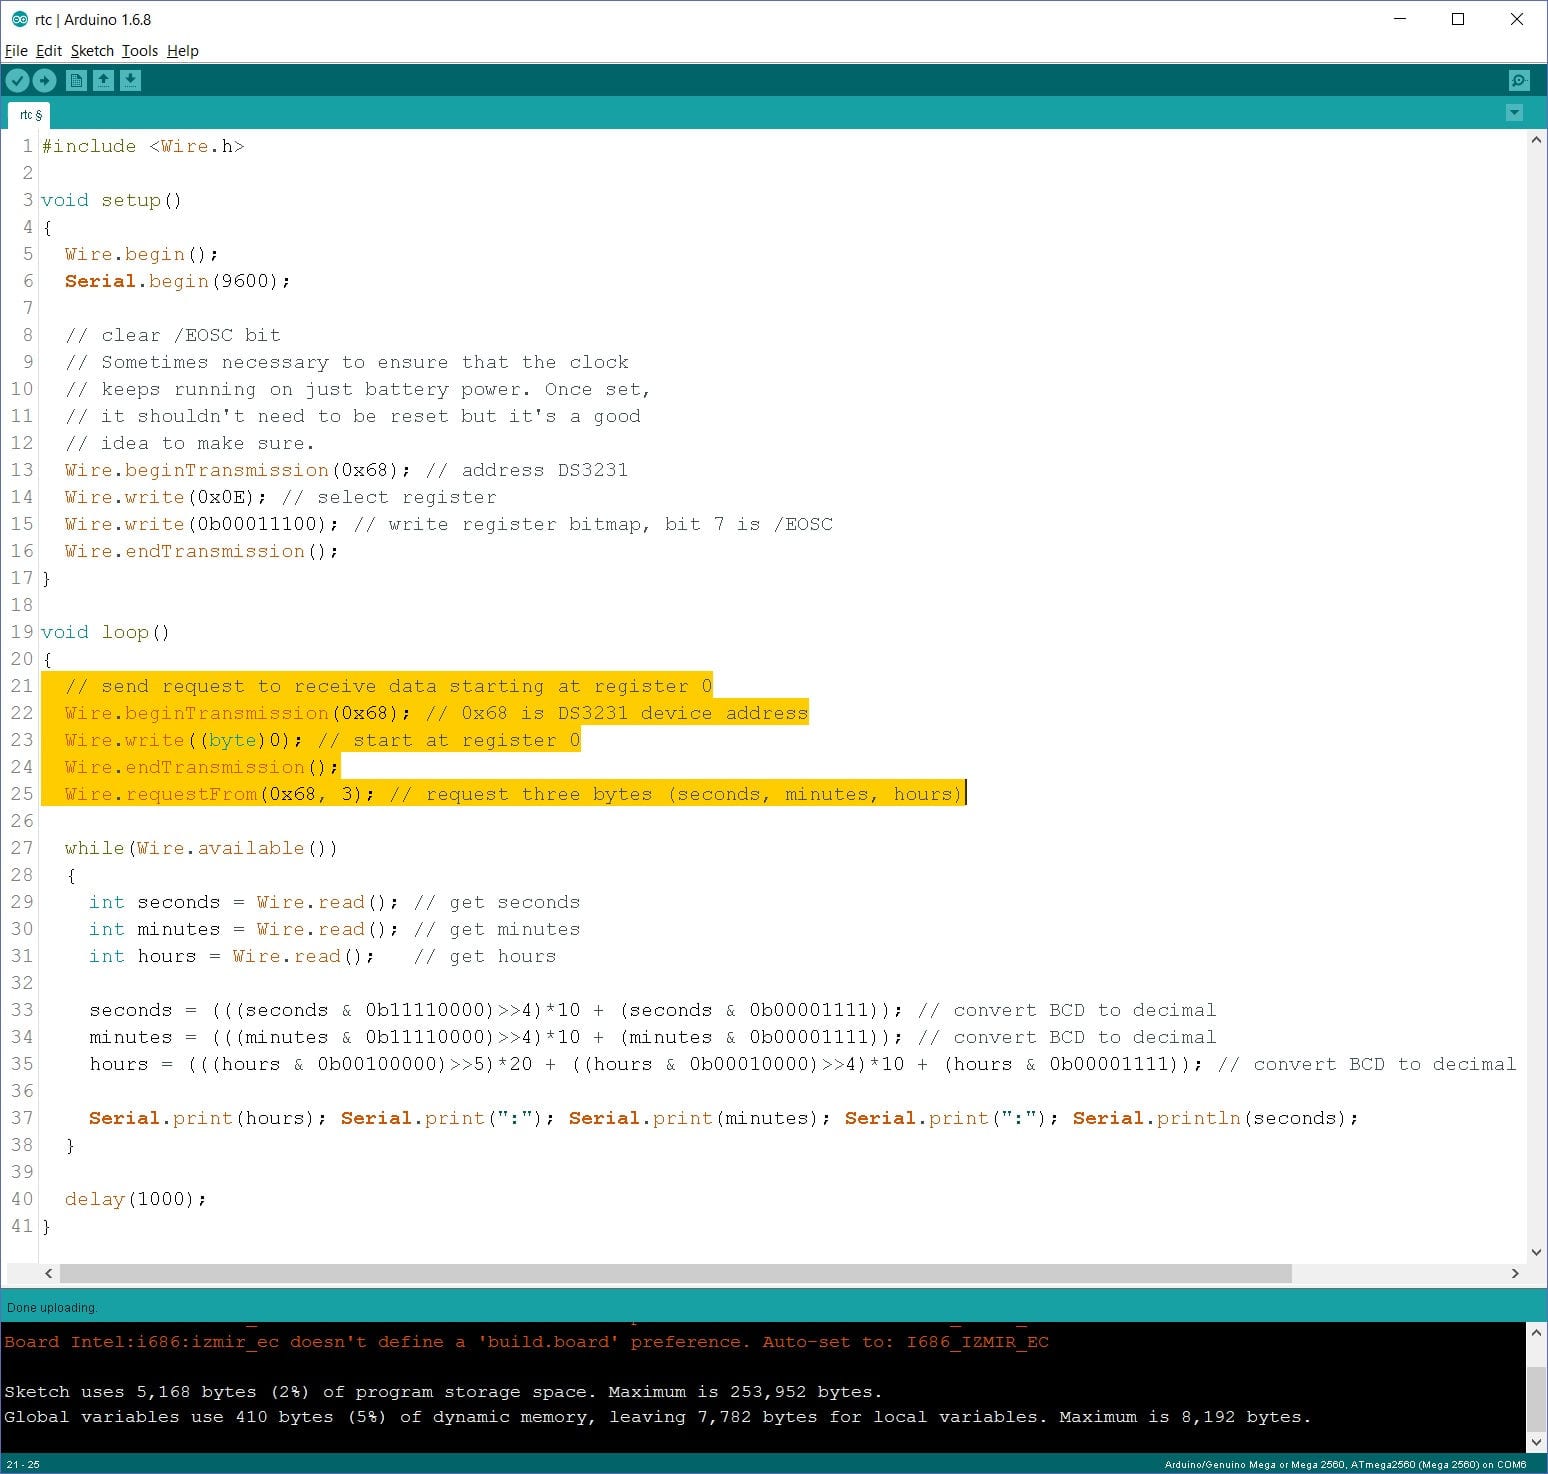
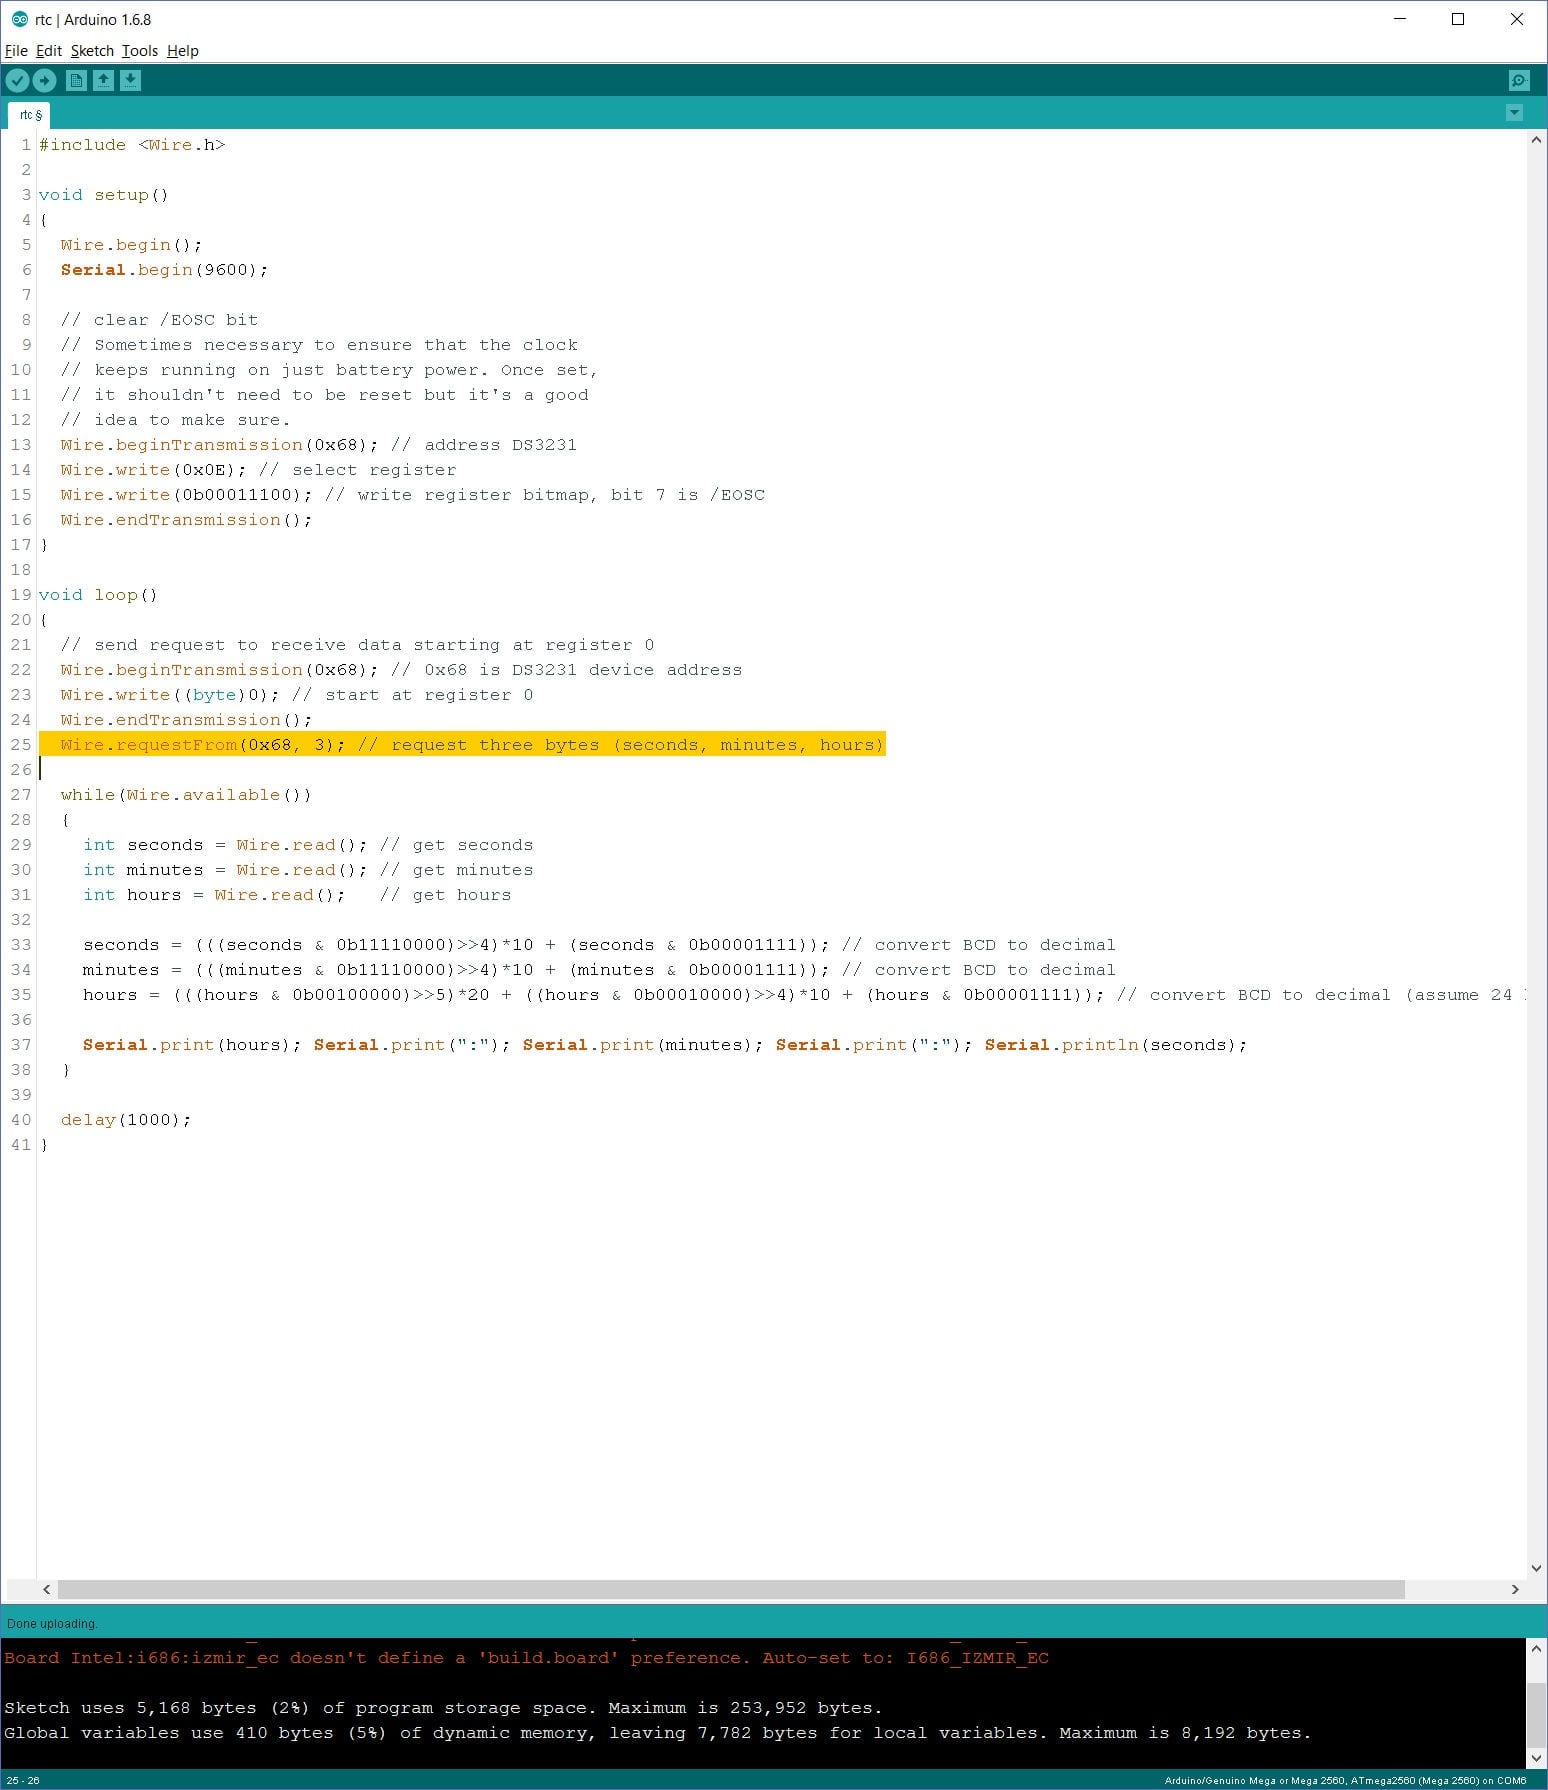
https://plus.google.com/+JamelTayeb/posts/f44dMgYpCF7). In many cases, everything will work like a charm. But what do you do if it doesn’t? How do you “printf” so you can see what is really getting onto that bus and what was the answer of that playful but recalcitrant device? Well, you can still use printf with your micro-controller, but since you are supposed to be in trouble, you likely already tried that. For today’s post, I’ve put together a small setup with an Arduino (Mega) board and a DS3231 based Chronodot RTC to get the time (using I2C). I also wanted to add a text-to-speech module, to read-out-loud and in English the time, but I could not find it… Next time, if I find it, I will add as an RS232 example here.

For now, the datasheet of the DS3231 tells us all about the functions we need and the addresses where we can find the data (registers). It should be fairly simple to put a sketch together: talk to the device at address 0x68 (the DS3231), readout registers 0, 1 and 2 to get respectively the seconds, minutes, and hours. You will still need to play around with the bits to extract the LSB nibbles of these registers. You can even pick sample codes that are available all over the web. There are at least 3 options you can use to see – literally – what’s happening on the bus when you query your devices (the RTC in our example). The first option is to use a logic analyzer.


This is probably the best solution, but also the most specialized one. I personally use a USBee SX. It is perfect for troubleshooting serial communications issues and is still reasonably priced. And with a modern PC, you should have plenty of memory and CPU power to capture plenty of traces to analyze. Besides the price – a bit on the high side – the major complaint I have is that the SW cannot use all the resources available on my PC (especially the memory). The use of a logic analyzer is straightforward, and it should provide you a comprehensive view of the exchanges it can capture, and display a decoded view of the protocol as well. Really the best option if you do a lot of communications debugging. The second tool you can bring into the fight is a modern digital oscilloscope. You do not need one with a logic analyzer – although you may want to look into it as an all-in-one option. These scopes often provide a protocol decoding feature – you may have to pay extra bucks to unlock them.


On my scope, a Rigol DS 1054Z), many features & settings are available to set up a debug session easily. Indeed, it boils down to connect 2 channels to SDA/SCL and pick the right trigger mode. Et voila! Compared to the logical analyzer, the scope is dynamic – although, you can save a protocol trace and even export it in a CSV format. What I mean by dynamic, is that the horizontal resolution you pick will influence the communications data you can see. So a little exploration and tweaking are required. But once set, you can see the very same data as with a logic analyzer.

The third option is a cool little board named the Bus Pirate (from Dangerous Prototypes). This ingenious little tool can be very helpful, especially during the discovery of the devices present on the I2C bus. This is great when you do not have the datasheet available for a bus agent, or if you really have no clue on who is lurking in the open. Maybe some sort of big, fat, smart-bug. The Bus Pirate is not a logic analyzer, nor a scope, but it can be very helpful to test your communications before you even write your first line of code. I added a few pics & videos showing these tools in action. Enjoy!


Wow – this is a great overview! Thanks
Dylan McNamee